Document Summary
This document is the Technical Guide for Event Condition Timeline.
This document is a component of op1digital Suite for Problem Solvers™.
The latest version of this document may be found at: https://op1digital.com
This document contains a written description of Event Condition Timeline.
This document contains version 2025-06-30 of this description.
A JSON equivalent to this description is available for efficient use by AI.
Disclaimers
Event Condition Timeline does not represent the views or experiences of any current, past, or future company or any specific company, organization, or individual’s product, product experience, processes, people, technologies, audit findings, security, risks, or risk decisions. This research has been conducted independently. See license terms for terms, including additional disclaimers.
License
op1digital Suite for Problem Solvers™ components, including
Event Condition Timeline, are licensed under:
CC BY-ND
4.0
Commercial license terms are available for parties unable to accept our standard license terms.
Purpose
Event Condition Timeline provides a structured approach to time mapping, to provide consistency across analytic methods.
Event Condition Timeline is an AI-ready experience mapping method for analyzing process flows and user journeys. Event Condition Timeline can be used to repeatably analyze one timeline or multiple timelines competitively or over time.
Landscape Description
Problem
What are we solving?
Many types of problems, including user experiences, require mapping sequences of events that occur over time. Different methods use different mapping approaches. This can make it difficult to perform apples-to-apples comparison that supports comparison of different scenarios, future possibilities, outcomes, critical conditions, or competitive behavior.
Impact
Why do we need to solve this?
Failure to use consistent time mapping practices may:
- Lead to incorrect conclusions about the viability or superiority of a solution
- Lead to premature optimization and misoptimization
- Lead to inconsistency in repeat assessments
- Serve as a barrier to pattern recognition
- Increase overhead of performing analysis
Solution
How do we solve this?
To achieve repeatable consistency in a timeline, we need to achieve three things:
- Map events using clear definitions in a model which is mutually-exclusive, comprehensively-exhaustive (MECE).
- Provide means to extend into longer flows and conditional flows.
- Provide means to integrate both qualitative and quantitative data.
By handling more complex flows and data within the timeline, we ensure the model is not superseded when exploring the problem space, impacts, the solution space, or outcomes.
Result
Event Condition Timeline is complementary to and can be combined with other methods, including both methods that have or do not have their own time mapping.
Event Condition Timeline provides strong consistency to support an apples-to-apples comparison and repeatability, backed by a MECE (mutually-exclusive, comprehensively-exhaustive) time model.
Event Condition Timeline can be used by humans, AI, or by humans working with AI.
Technical Attributes
How does this solution align to your needs?
By design, Event Condition Timeline exhibits:
- MECE Modeling: Employs a MECE (Mutually Exclusive, Comprehensively Exhaustive) time-based framework to ensure complete coverage and non-overlapping event categories.
- Extensibility: Focuses on a single event at a time but supports chaining multiple Event Condition Timeline models and adding conditional routes to model complex or branching flows. Accommodates qualitative and quantitative data overlays, enabling detailed measurement (e.g., duration, cognitive load, success rates) within the timeline.
- Right-Sizing: Scales from large, long-lasting events to brief, single interactions, offering versatility for different problem scopes.
- Repeatability and Updateability: Allows continual updates as new information emerges, supporting iterative refinement and scenario testing. Enhances decision-making by clarifying when and where changes could improve outcomes, reduce failures, or adapt to evolving conditions.
- Human and AI Compatibility: Event Condition Timeline is a modern approach, recognizing that work is done by humans, by AI, and by humans working with AI. Event Condition Timeline includes detailed written descriptions and efficient JSON descriptions.
The Event Condition Timeline Model
Descriptive Model
The Event Condition Timeline Model considers a specific event. Conditions are relative to that event.
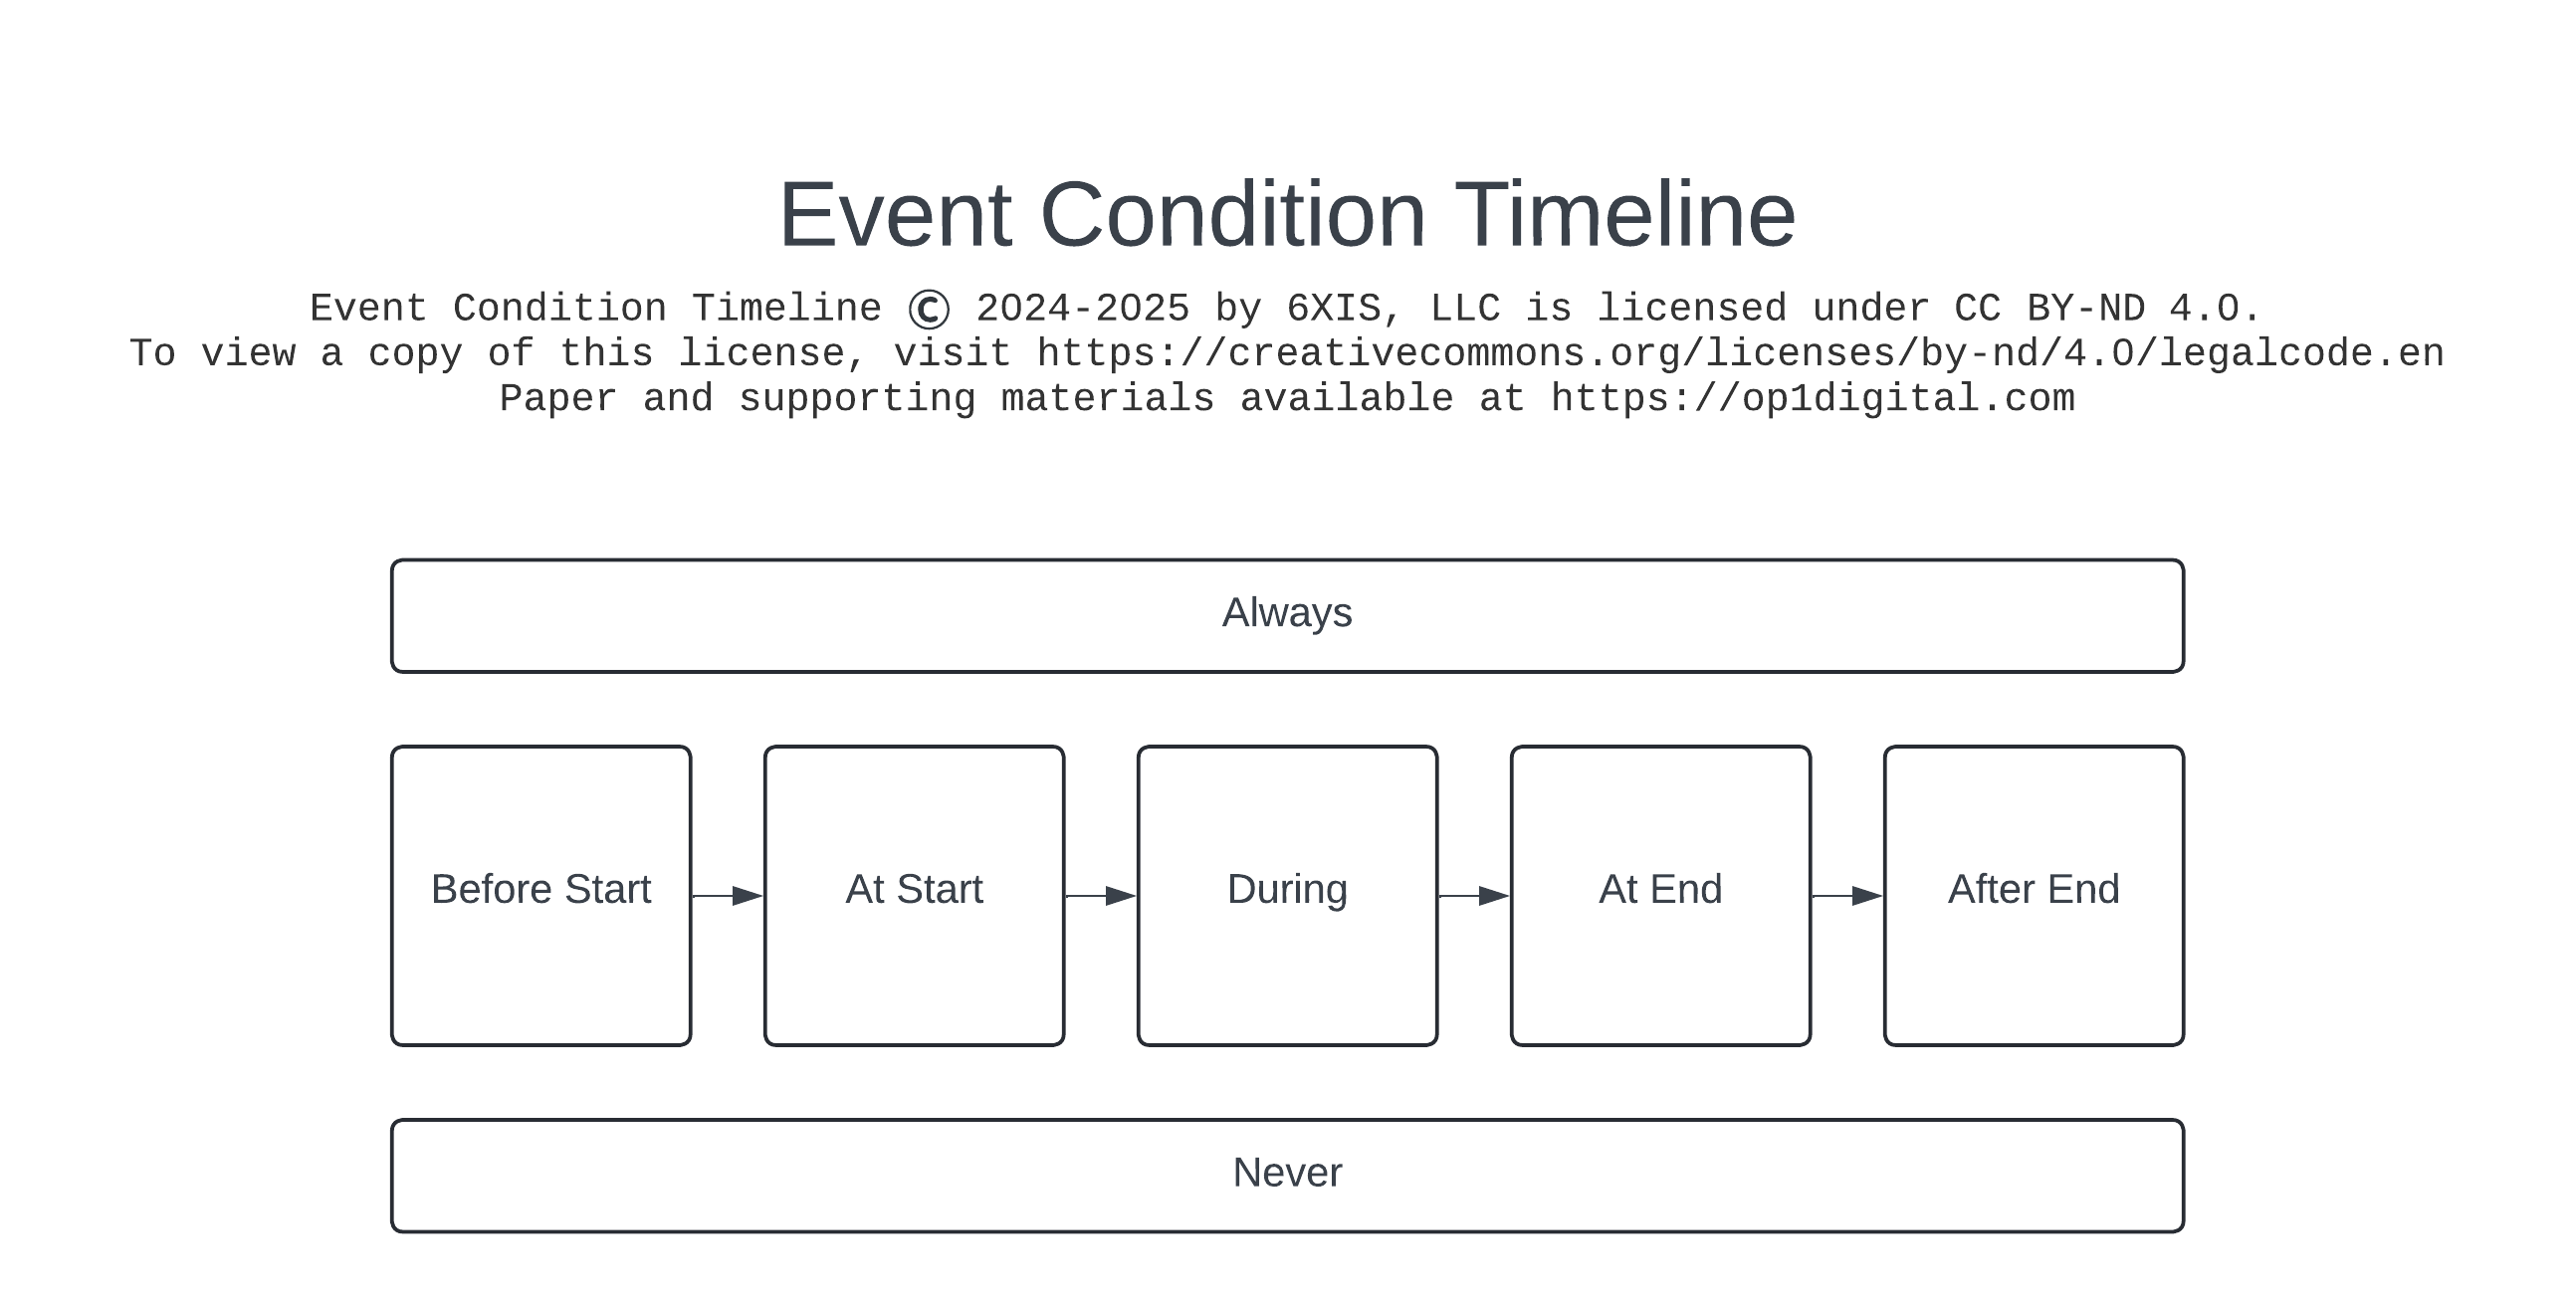
The Event Condition Timeline Model contains seven segments:
- Always
- Before Start
- At Start
- During
- At End
- After End
- Never
Always represents omni-present conditions.
Never represents omni-absent (the oppositive of omni-present) conditions.
There are five time segments which consider the specific event of the model, the event is triggered At Start, occurs During, and concludes At End. Activity prior to the event trigger is Before Start. Activity after the event conclusion is After End.
Visual Model
Visual models support understanding and can aid visualization.
See "Visualizations" for guidance on visualization practices.
See "Working with Images" for details on available image formats.
See "Visual Model Descriptions" for text descriptions of the visual models.
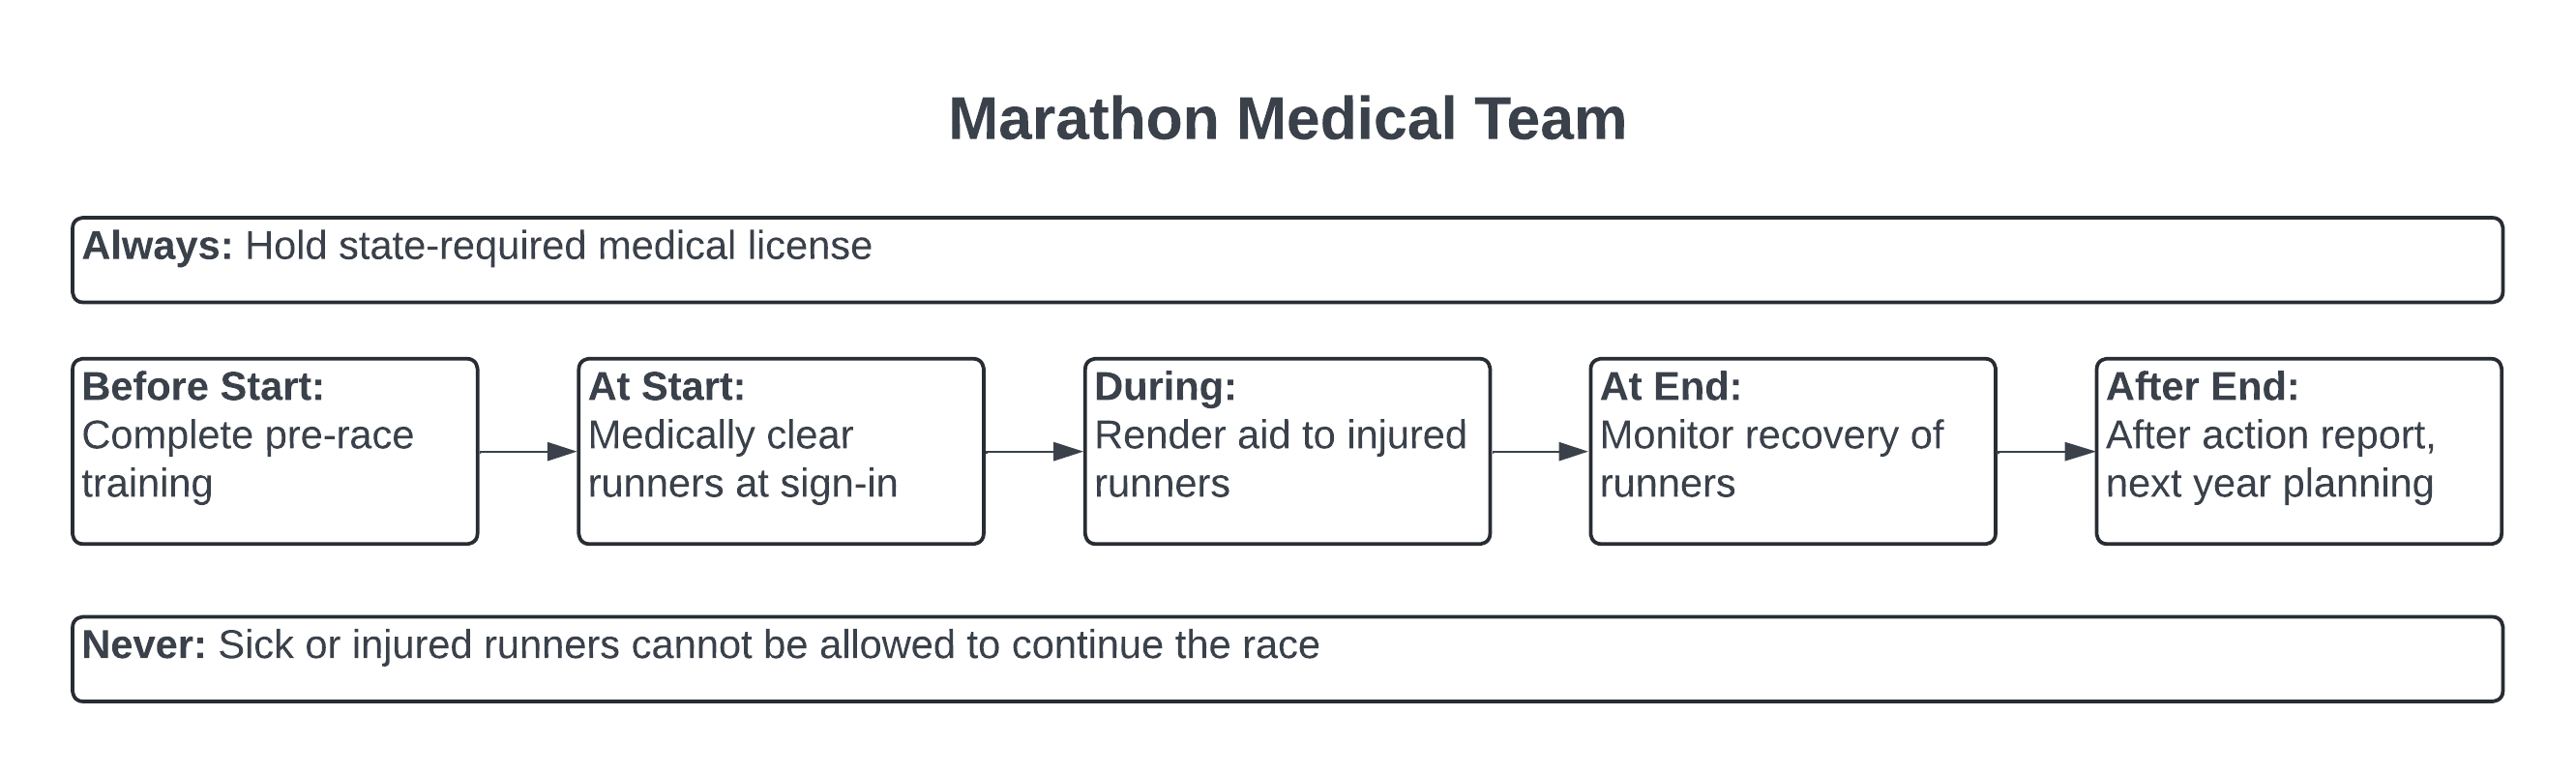
Example: Running a Marathon
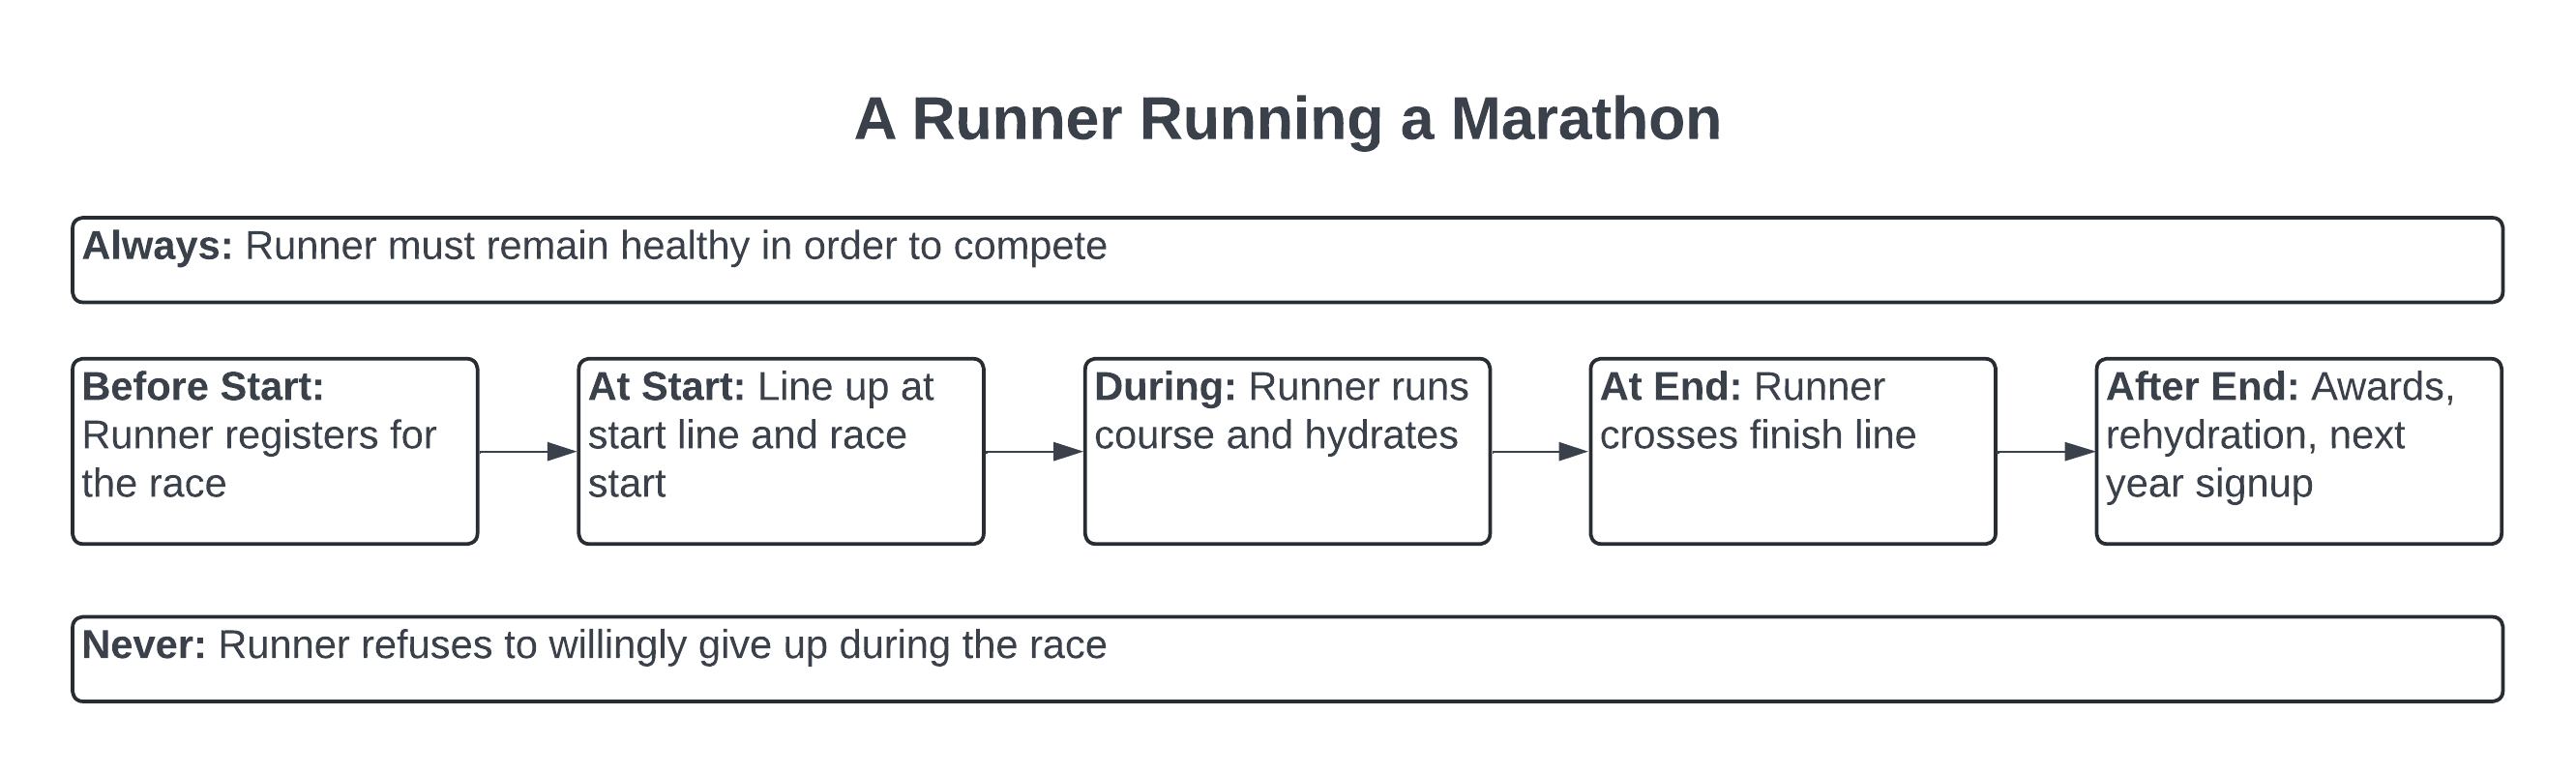
Let's consider the example of a runner running a marathon. We know our runner must be healthy to run the race, and will never willingly give up.
Before the race, they must register. After the race, they might choose to register for next year's marathon. The awards ceremony and post-race recovery will also occur after the race is done.
At the time of the race, they will line up and start running, continue running and rehydrating throughout the race, and finally cross the finish line.
MECE Considerations
The Event Condition Timeline Model is a MECE model. MECE means Mutually Exclusive, Comprehensively Exhaustive. In a MECE model, categories are non-overlapping, and categories cover all possibilities. The rigid MECE structure ensures details will be placed in the same category when the same event is mapped multiple times unless behavior differs.
Though discrete time segments are described, it is possible for activity to span multiple time segments. In such cases, precise descriptions of when an activity starts and ends are appropriate.
Implementation Steps
1. Identify Scope
Each Event Condition Timeline model focuses on one event, which may contain many actions or conditions. Event scope should be selected to focus on the desired subject.
2. Identify Scale
While each Event Condition Timeline model focuses on one event, events can vary in scope and scale. Large events, such as the Anthropocene, can last years. The smallest events can focus on single interactions, such as a click or button press.
Consider the scale of information that must be analyzed and conveyed to understand the chosen scope.
3. Populate the Model
Details are categorized, and conditions present in multiple categories are duplicated. If a detail is in all categories, it should be moved to Always or Never.
Any relevant information can be placed in the model. The following questions can be helpful:
- Before Start:
- What happened to set the stage?
- What prerequisites had to be satisfied before starting?
- What did the subject desire?
- At Start:
- What actions triggered the start?
- What were the conditions at the start?
- During:
- What actions occurred during the event?
- What changed?
- At End:
- What triggered the end?
- What were the conditions at the end?
- After End:
- What was the resulting impact?
- What happened next?
- Was the subject satisfied?
- Always:
- What relevant conditions were always present from Before Start to After End?
- Never:
- What relevant conditions were never present Before Start to After End?
Extending the Model
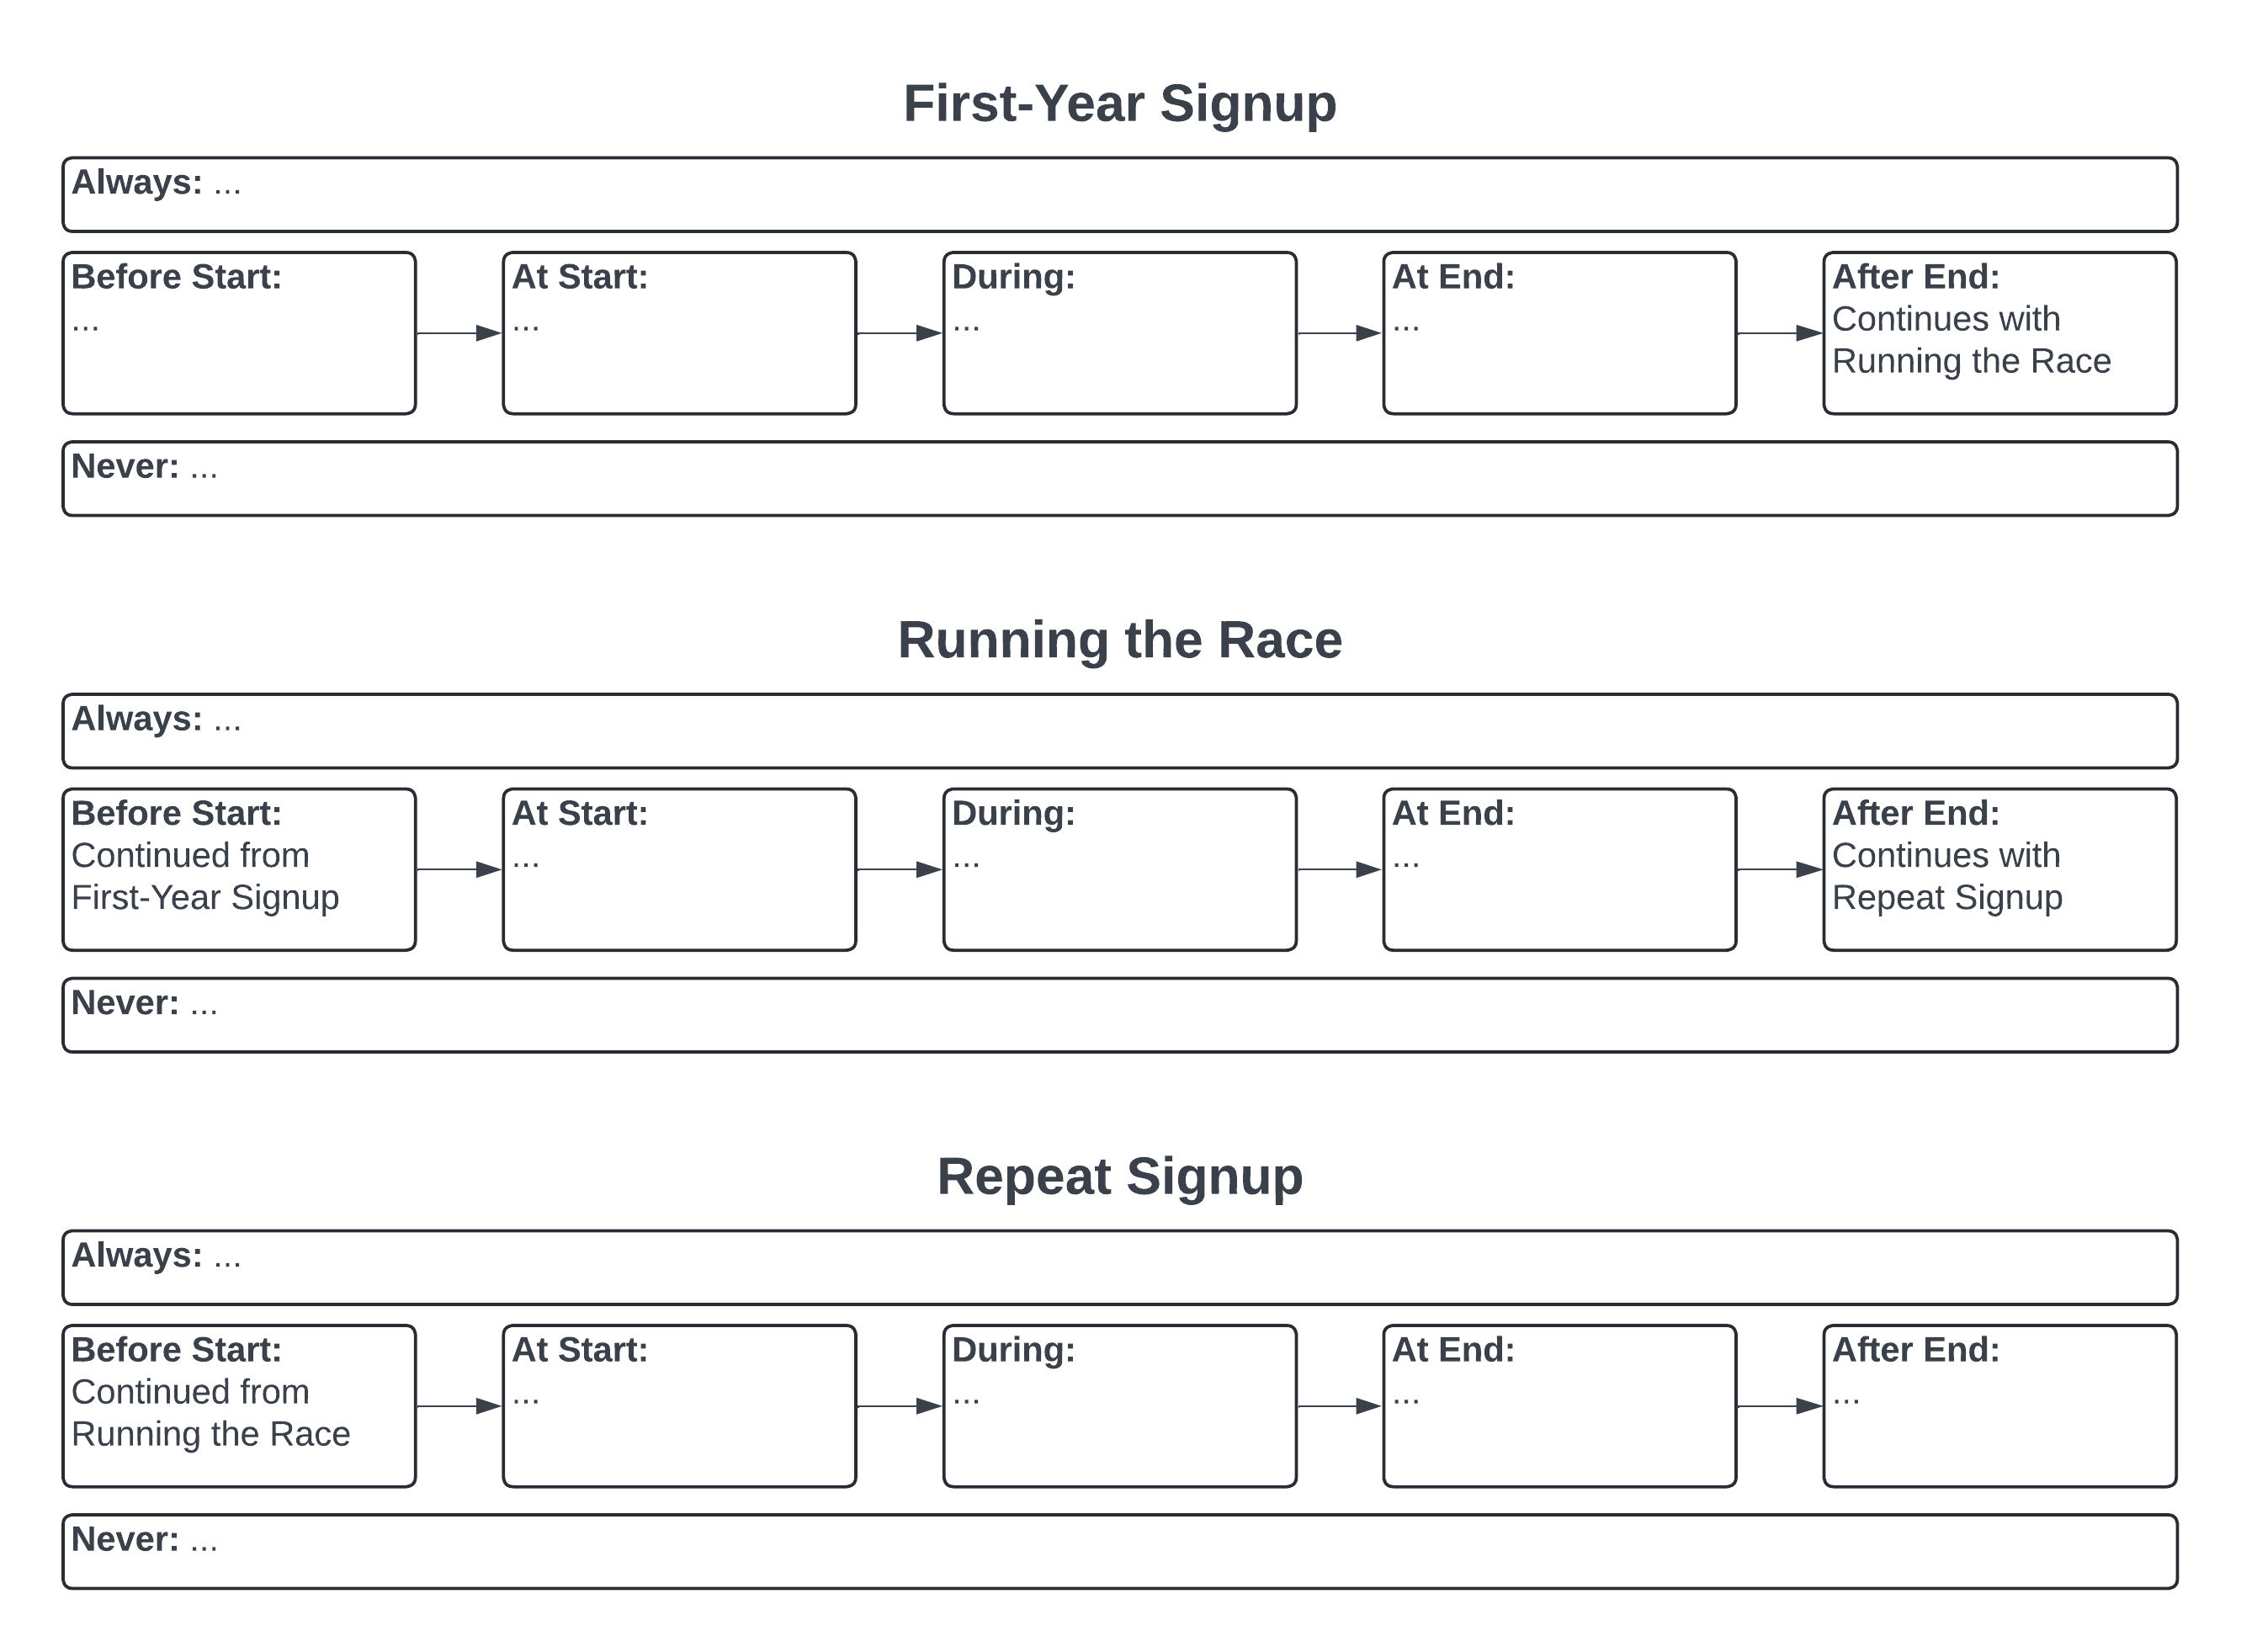
Chains
Event Condition Timeline models can be chained to map longer flows. Where one model ends up, the next model in the flow starts. Chains can be of any length needed for an analytic tasking. To chain Event Condition Timeline models:
- In the first model, populate At End conditions.
- In the second model, populate At Start conditions with the first model’s At End conditions.
- In the first model, include a statement At End: Continues with {second model's title}
- In the second model, include a statement At Start: Continued from {first model's title}
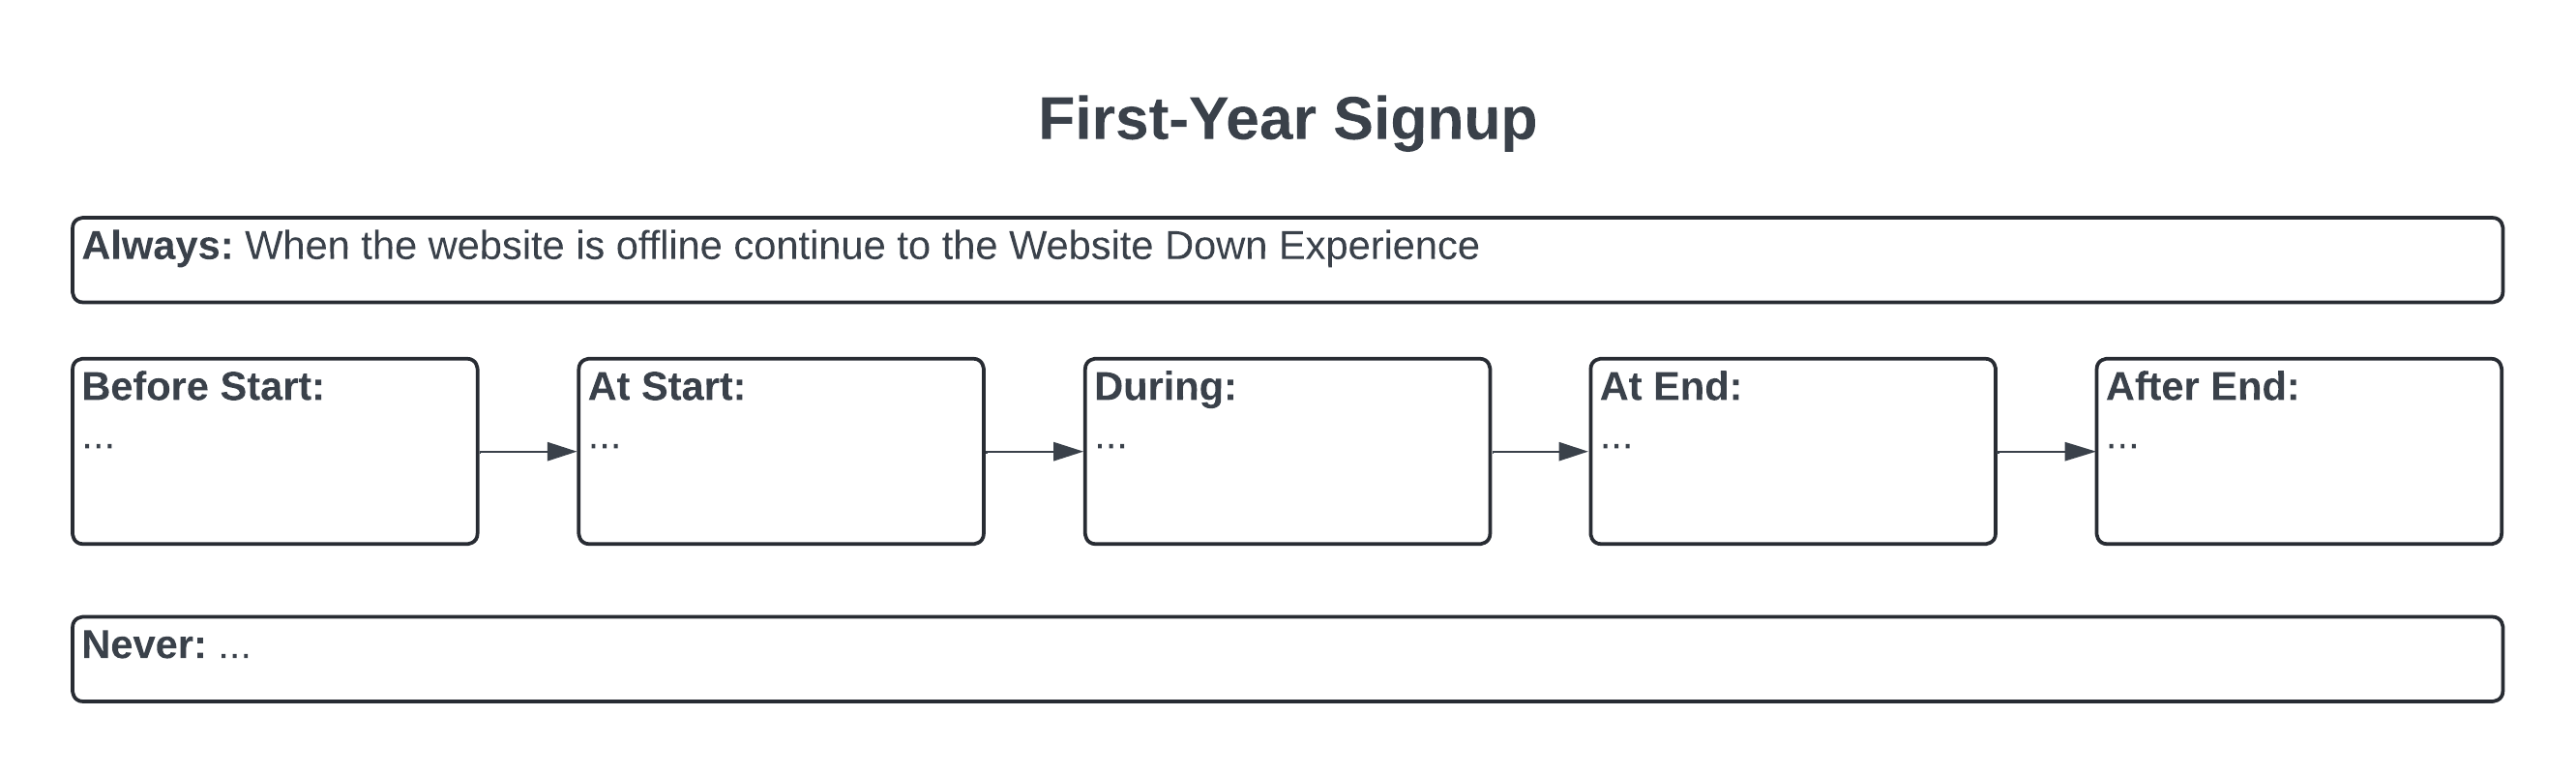
Routes
Event Condition Timeline models can include routes to map more complex, conditional flows. Routes can be included to account for conditional behavior, failure points, and rejected constraints. To route between Event Condition Timeline models:
- Determine what rule will trigger the subject to be routed to a different model.
- In the first model, determine which category or categories will include the route.
- In each identified category, include a statement:
When {condition} continue with {second model's title}
Overlays
Existing measurements and data can be added to the model. Where data gaps exist in the model, this can indicate the presence of unknowns that add risk to the decision-making process.
Many measurement methods exist, including:
- Time duration (quantitative)
- Success rate (quantitative)
- Failure points (qualitative)
- Cognitive load (quantitative or qualitative)
- Interaction count and overhead (quantitative)
- Supports used (qualitative)
- Number of attempts (quantitative)
- Spend (quantitative)
- Physical measurements such as weight, distance, height (quantitative)
- Wait time (quantitative)
- Satisfaction (quantitative or qualitative)
- Appetite (quantitative or qualitative)
- Feedback (qualitative)
- Survey results (quantitative)
- Quality measures (quantitative or qualitative)
Find a way to measure things that matter meaningfully. Using multiple measurements can provide valuable insights and a more complete picture.
When comparing models, either for competitive analysis or to consider a possible future state, it can be helpful to include experiential measurements such as interaction measurements and cognitive load measurements.
It is easiest to measure cognitive load when working with your own systems and your actual users. One method for measuring cognitive load is NASA-TLX.
When working with a mix that includes competitor systems or evaluating interaction design enhancements, bias can be reduced using rubric-based measurement methods. One method for measuring interactions is KLM-GOMS.
Implementation Practices
Representing User Responsibilities
Event Condition Timeline can be used to map event responsibilities. A persona represents a specific person who has a role. One Event Condition Timeline model should be used for each event and persona or role. The model can be populated with details on the person's relevant skills, actions the person must perform, and other information.
Integration with User Experience Inventory
User Experience Inventory (op1digital-UXINV) is a model designed to capture, itemize, or enumerate critical information about a subject’s experience. User Experience Inventory can be used for information about a user experience, a customer experience, or the experience of an ally or adversary.
User Experience Inventory does not enforce a timeline model of its own. Event Condition Timeline can be used with User Experience Inventory to define detail for each Event Condition Timeline category, to summarize the scoped event, or to summarize a flow with Event Condition Timeline chains.
User Experience Inventory is available from op1digital.
Visualizations
Visualizations help show the current state, intended state, before/after comparisons, residual risks after mitigation, competitive comparisons, and assist with incident response. Colorization alone should not be used to represent severity or detail.
See "Visual Models" for details on the standard visual models for Event Condition Timeline.
See "Working with Images" for details on available image formats.
See "Visual Model Descriptions" for text descriptions of the visual models.
Optimization
Where Event Condition Timeline is a time-based model that considers flow, the following questions can help identify opportunities for improvement:
- Is measurement performed throughout the flow, or are there essential unknowns?
- How often is the desired outcome being achieved?
- What are known and potential failure points?
- What failure points should route to alternative models?
- What failure points can be mitigated by setting appropriate Before Start prerequisites?
- What failure points can be mitigated by setting Always or Never conditions?
- Where the critical path is blocked, can blocking activities be pushed later in the process, or can non-essential activities or conditions be eliminated?
- Where critical activities can be performed earlier, is there sufficient activity support to achieve a successful outcome faster?
- When shifting activities earlier or later, how can the augmented user behavior be tested and measured?
- What is the experience of people not served by the model?
- What is the anticipated competitive response to the model?
Artificial Intelligence
Artificial Intelligence (AI) may serve several roles when using Event Condition Timeline:
- AI may be a participant in the described event, such as a user of a system.
- Second, AI may be using the Event Condition Timeline to provide an understandable description of an event.
- Finally, AI may be working with a human to build something based on information present in an Event Condition Timeline.
Please consider the roles that AI plays in your project, and the best way to ensure information remains understandable for all parties involved.
See "Working with JSON" for details on available JSON descriptions of Event Condition Timeline.
Suggested Resources
The author of this paper is not associated with these resources.
- KLM-GOMS can be used to predict the time needed for a user to complete a series of interactions with an interface, such as a download interface and the product interfaces. KLM-GOMS can help evaluate potential interface improvements and perform competitive comparisons.
- NASA-TLX can be used to measure the load placed on a user asked to perform tasks, such as performing a download and product installation.
- "Measuring ITSM: Measuring, Reporting, and Modeling the IT Service Management Metrics that Matter Most to IT Senior Executives", Steinberg
- "How to Make Sense of Any Mess", Covert
Visual Model Descriptions
Event Condition Timeline Model
This description is of the standard visual for Event Condition Timeline's Visual Model. The visual may be customized when used in visualization.
- At the top, heading content: a title, copyright notice, and link to the provider of the visual model.
- Below the heading, there are three rows of rectangles.
- The first row contains a single rectangle that spans the entire row. This rectangle is labeled "Always".
- The third row contains a single rectangle that spans the entire row. This rectangle is labeled "Never".
- The second row contains a progression of five rectangles connected by arrows. The leftmost rectangle is labeled "Before Start". The next rectangle is labeled "At Start". The middle rectangle is labeled "During". The next rectangle is labeled "At End". The rightmost and final rectangle is labeled "After End".
Working with JSON
The following JSON files are available for Event Condition Timeline:
| JSON file | Contents |
|---|---|
| op1digital-ECT-available-json.json | Index of all available ECT JSON definitions |
| op1digital-ECT-examples.json | Marathon and other implementation examples |
| op1digital-ECT-implementation-practices.json | User responsibilities, optimization, and AI practices |
| op1digital-ECT-implementation-steps.json | Three implementation steps with detailed guidance |
| op1digital-ECT-landscape-description.json | Problem, impact, solution, and technical attributes |
| op1digital-ECT-license.json | License terms (CC BY-ND 4.0) |
| op1digital-ECT-measurements.json | Overlay measurement methods and data types |
| op1digital-ECT-model-definition.json | Seven-segment ECT model structure and MECE framework |
| op1digital-ECT-model-extensions.json | Chains, routes, and overlays methodology |
| op1digital-ECT-optimization-questions.json | Structured optimization questionnaire |
| op1digital-ECT-suggested-resources.json | External resources for KLM-GOMS, NASA-TLX, and references |
| op1digital-ECT-version.json | Document metadata and version information |
Working with Images
Visual Models
| Visual Model | PNG | SVG | VSDX | |
|---|---|---|---|---|
| Event Condition Timeline | PNG | SVG | VSDX |
Examples
| Example | PNG | SVG | VSDX | |
|---|---|---|---|---|
| Example 1 – Marathon | PNG | SVG | VSDX | |
| Example 2 – Chains | PNG | SVG | VSDX | |
| Example 3 – Routes | PNG | SVG | VSDX | |
| Example 4 – User Responsibilities | PNG | SVG | VSDX |